What is Microsoft Clarity?
Intro
Microsoft Clarity is a free heat mapping and session recording tool for websites. This tool helps provide more meaningful analytics about how users interact with websites. I will cover how to add Microsoft Clarity to your website and what makes it such a powerful tool.
Prerequisites:
- Some website knowledge.
- Some knowledge of heat mapping and analytics.
Installation
The first step after registering a Microsoft Clarity account is to create a new project. Add a name and URL for your website, then you’ll have a new project. Next, you’ll have a prompt with information to add the code to your website. I would recommend the “Install Manually” option. This option will provide you with a JavaScript snippet to add to your website.
<script type="text/javascript">
    (function(c,l,a,r,i,t,y){
        c[a]=c[a]||function(){(c[a].q=c[a].q||[]).push(arguments)};
        t=l.createElement(r);t.async=1;t.src="https://www.clarity.ms/tag/"+i;
        y=l.getElementsByTagName(r)[0];y.parentNode.insertBefore(t,y);
    })(window, document, "clarity", "script", "xxxxxxxxxx");
</script>
This snippet is an example of the code. Add this snippet in the head tag of your website. Now recordings of the site will save moving forward.
Add Google Analytics to your project (recommended)
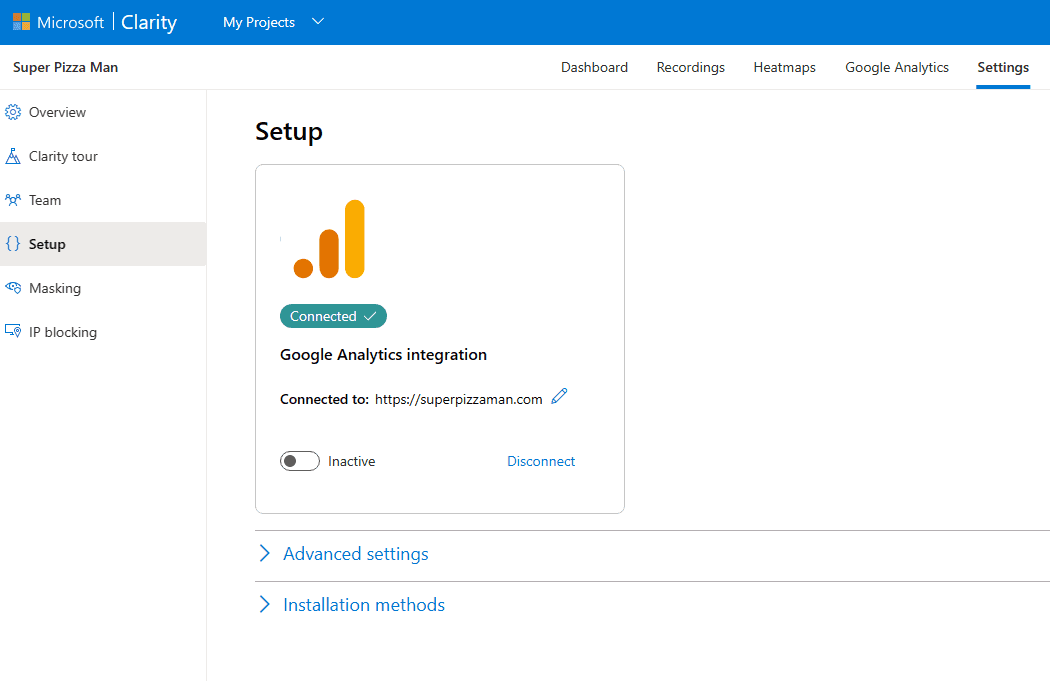
After your project is set up, you can also connect to Google Analytics. This will combine Google Analytics data with Microsoft Clarity.
To connect to Google Analytics visit “Project Settings,” and then navigate to “Setup.” The setup is where you will be able to connect to Google Analytics. Once connected, you should be able to filter data in Microsoft Clarity.
Using Microsoft Clarity
Dashboard
When you visit your project dashboard, you will see a lot of analytics. On the dashboard, you can filter the data based on different segments. The dashboard is currently sort of a light version of Google Analytics.

Recordings
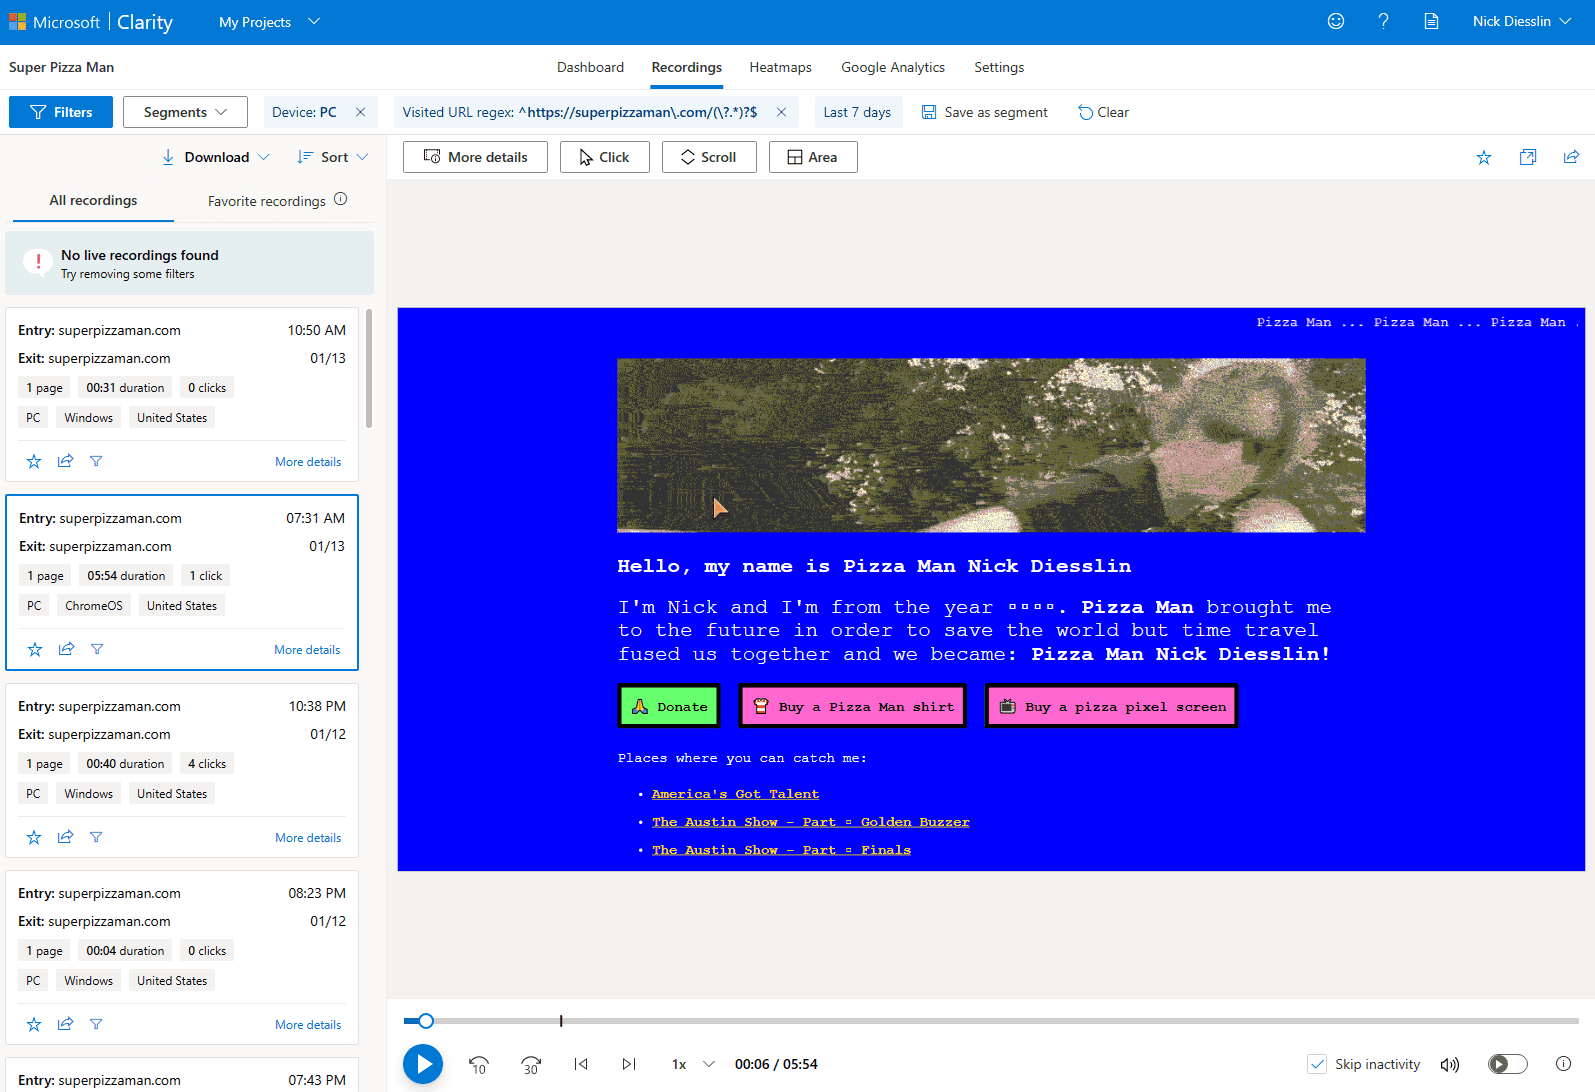
The recording tab allows you to view recordings of visitor interactions. Each visit gets an individual recording. You will have information about each recording. The information includes duration, clicks, device type, pages visited, and location. Each recording allows you to replay the recording and view what the users hover over and click on. This information is crucial for understanding how users interact with your website.
I like recordings because you can add labels to mark them. You can favorite and share recordings. Recordings can share to specific email addresses or as a public URL. This is beneficial for sharing insights with teammates or clients.
Heatmaps
The heatmaps tab in projects allows you to view the heatmaps of pages. Each page can provide a heatmap for the segmentation desired. Using the segmentation, you can see heatmaps for a timeframe.
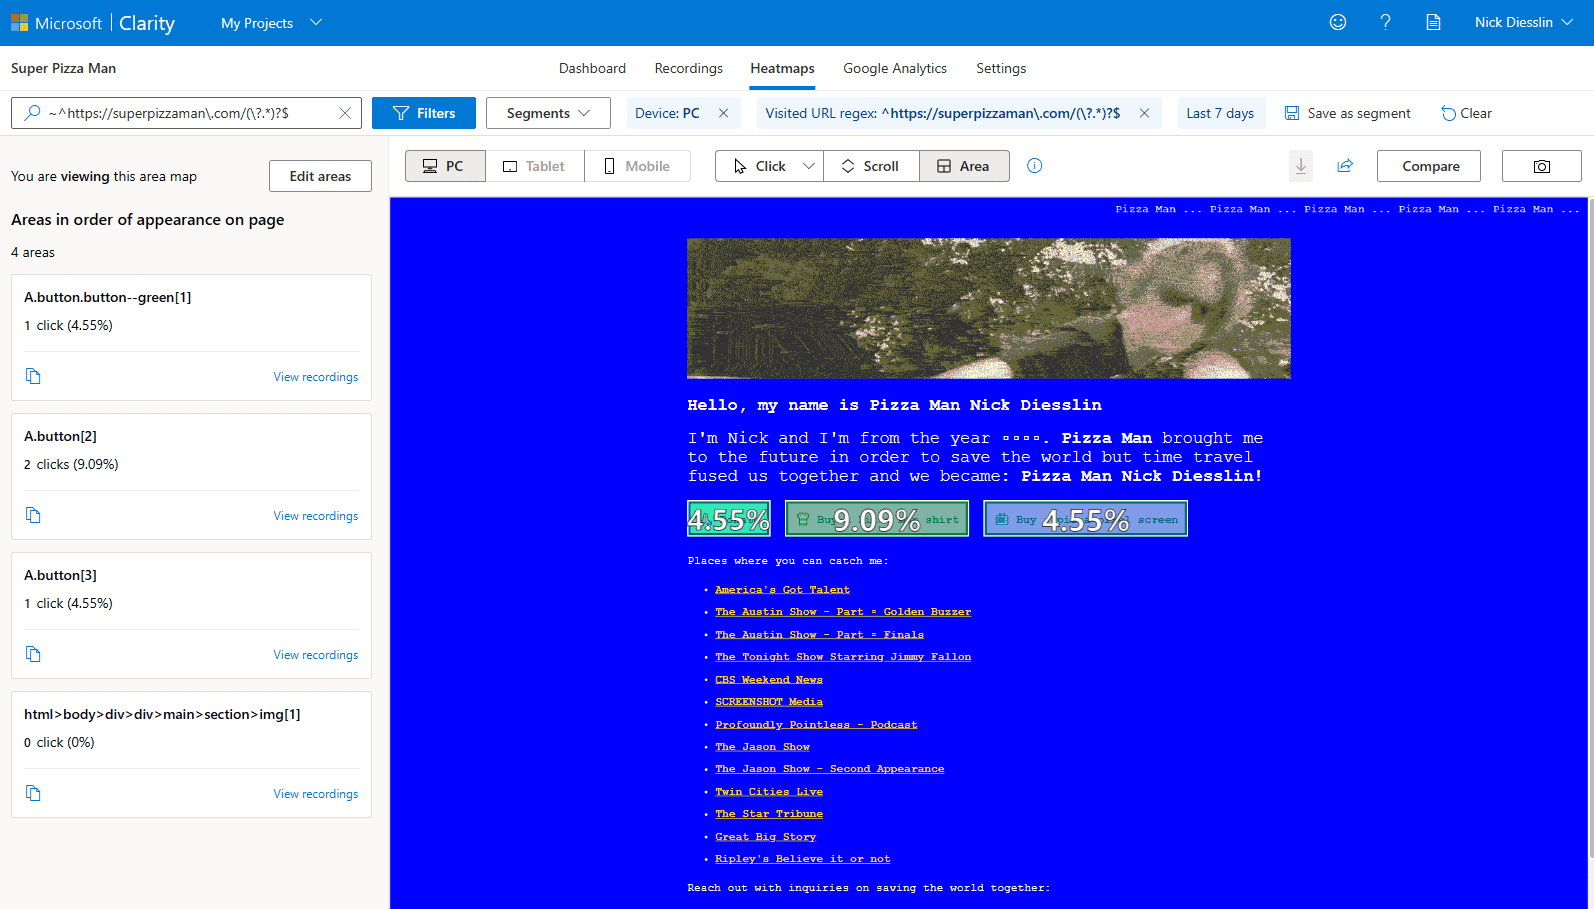
Heatmap options
- Device type (desktop, tablet, mobile).
- User interaction type click, scroll, or areas. Each type is helpful for understanding user interactions. The areas option allows you to select specific items of interest on the heatmap.
- Like recordings, each heat map is shareable.
Conclusion
Microsoft Clarity is a free heat mapping tool for websites. This tool provides user interactions at an individual level. I’d recommend adding this tool to your website. It’s a free tool that claims to be free forever, WOOT!
References
Microsoft Clarity
About the author


Written by Nicholas Diesslin Pizza acrobat 🍕, typographer, gardener, bicyclist, juggler, senior developer, web designer, all around whittler of the web.
Follow Nick on Twitter!